When Harry Met Sally
When Harry Met Sally
(Part 1 – A Primer on Financial Analysis)
Let us go down the memory lane and recall the classic rom-com, “When Harry Met Sally”, from the late 1980s featuring Harry Burns (Billy Crystal) and Sally Albright (Meg Ryan). The arguments between Harry and Sally provide an interesting backdrop for explaining the interplay between different thought processes while constructing your financial envelope.
Allow me to borrow two fictional characters from the movie. Sally and Harry represent the marketer and the finance guy respectively. The graphic below personifies the inherent tension between marketing which fosters creative thinking and free play and the finance function that is numbers-based, and metrics-driven.

Sally would like to expand reach, create awareness, generate leads and conversion. But Harry erects roadblocks along the way to make sure the campaigns are cost-effective and optimally executed.
Although Harry’s position appears rational due to its data-driven approach, it also has its shortcomings. Marketing campaigns create brand equity in the medium to long term. However, a typical financial model does not capture the effects of intangibles such as brand recall, equity, etc.
Nevertheless, Sally’s view should also be tempered by short-term metrics such as Cost Per Lead (CPL), Cost Per Conversion (CPC), Return On Ad Spend (ROAS), etc. In short, striking the right balance between Harry’s and Sally’s worldview is key to steering campaigns effectively.
Before we get into financial modeling, let us first dive right into the terms of online advertising by typing the word “insurance” in the Google search box and see what happens. An example is shown below:

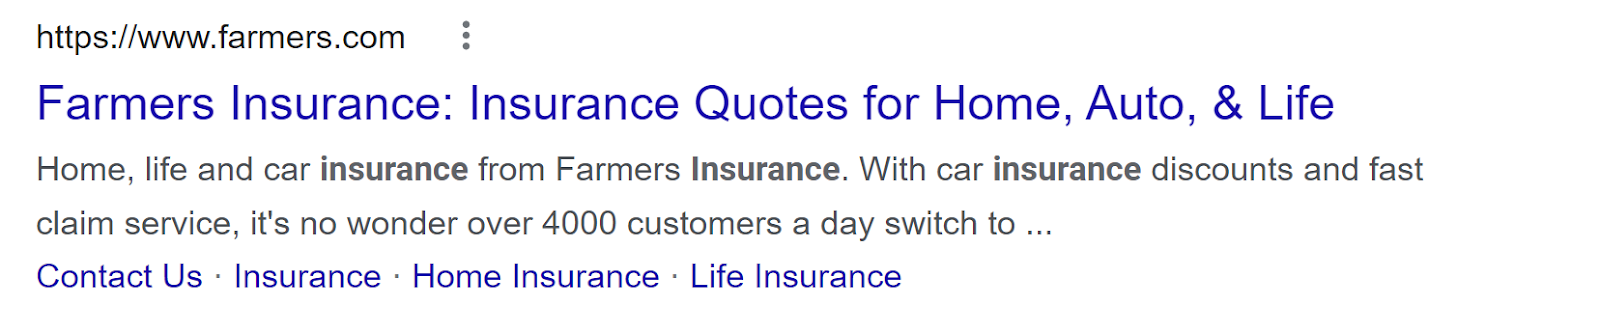
Paid ads are shown either on the top or the bottom of the Google search results page. All organic search results are typically sandwiched between paid ads. Now, let’s do a quick summary of the key terms and metrics involved.
Impression: Defined as any ad shown on a search query or a Facebook page or any website. It is critical for creating and expanding brand awareness.
Click: As the name suggests, it is only counted when the users click the ad which either takes them to a web or Facebook page.
Click through Rate (CTR): (Formula: Clicks/Impressions). It is a measure of how often we can persuade a visitor to click on an ad. The higher the CTR, the greater the success rate with engaging the consumer.
Cost per 1000 impressions (CPM): (Formula: (Total cost/Total impressions) *1000). The lower the CPM, the better off the advertiser or marketer is.
Cost per Click (CPC): (Formula: Total Cost/Total Clicks) Lower the CPM, the better off the advertiser or marketer is.
Return on ad spend (ROAS) = Total Revenue/Total ad expense. A strong indicator of ad performance. Excellent for comparing across different ad networks.
Return on investment (ROI) = (Total Revenue – Total ad expense)/Total ad expense. Traditional financial metric
Before clicking the ad, many web browsers are impressed with ads. Only a fraction of the viewers clicks the ad. Given the above context, let us delve into the customer journey to get a good handle on some of the metrics that govern campaign performance.
Typical customer journey – B2C - Real Estate Marketing
The above example illustrated above demonstrates that a small fraction of the web traffic or impressions convert into real customers. Let’s further understand the business case of spending ad dollars for impressions, clicks etc. for a real estate agent.

Suppose the agent sold ten homes in Manhattan, NY, and each cost $1,000,000. Additionally, agent commission is 5%. For the sake of simplicity, let us ignore travel, back-end expenses to parent firm etc. How much money can he/she shell out per 1000 impressions (CPM – Cost per 1000 Impressions) to obtain a ROI of 300%?
Fasten your seat belt and we will work through the math systematically.
Desired return = 300 % = (Total Commission Earned – Ad expense)/Ad expense Equation 1
Total Commission earned = 5% * $1,000,000 * 10 (for selling 5 homes) = $500,000
Rewriting equation 1 we obtain the following:
Total Commission = Ad expense + Desired return * Ad expense Equation 2
Substituting the given values such as desired return & commission, we obtain the following:
Ad expense (1 + 3) = $500,000 => Ad expense = $ 125,000
Cost per 1000 impressions (CPM) = (125,000/1,000,000) *1000 = $125
Net income = $500,000 - $125,000 = $375,000
In part 2, we will discuss how to build a complete financial model so you can understand Harry’s point of view fully.


CASINOS OF NJ - JT-TV Hub
ReplyDeleteJT-TV brings you the best NJ 여수 출장마사지 slots and video 의정부 출장샵 poker, bingo, casino, live games and more! Sign 평택 출장샵 up 경상남도 출장샵 for our exclusive 오산 출장안마 newsletter.
Loved readiing this thanks
ReplyDelete